App DSAP Studio – Digital Signal Analysis and Processing Studio
DSAP Studio has a new home at https://www.dsapstudio.app/
DSAP Studio is a digital signal analysis tool and of course tool for analyse digital filter as well. It allows a discrete signal or its spectrum to be read in a specific format, Fourier or inverse Fourier analysis of the signal, and digital filtering. With DSAP Studio software you can set up your desired filter parameters and generate easily according filter coefficients, export the filter coefficients in form ready to copy/paste to your embedded system or other code. DSAP Studio helps you in digital signal processing (DSP) and dogital signal filtering (DSF). Various window functions rectangular, triangular, Hamming, Blackman, Hann, Flat-Top, Welch can be used in analysing and processing.
Import of signals or spectra recorded directly from the oscilloscope is supported:
Rohde & Schwarz R&S RTB, RTM, RTA and RTC series.
From DSAP Studio user can export data of signals and spectrums to import them to oscilloscope (again supported oscilloscopes are R&S RTB, RTM, RTA and RTC series).
Reading signal or spectrum data (points) from other source is possible (from version 3.4). Data have to be on csv formatted file, where field separator is comma. Numbers can be in scientific (exponential) notation, decimal separator is decimal point. To load data from such file you should set:
for first data line: line munber in file (count starts from 1),
for horizontal data (time, frequency): column number where is data , unit (s, Hz), factor,
for vertical data (voltage, current, relative): column number where is data, unit (V, dBm, A), factor.
Factor different than 1 is needed when source of raw data does not does not take into account probe attenuation and other settings.
DSAP Studio is avalable on Microsoft Store
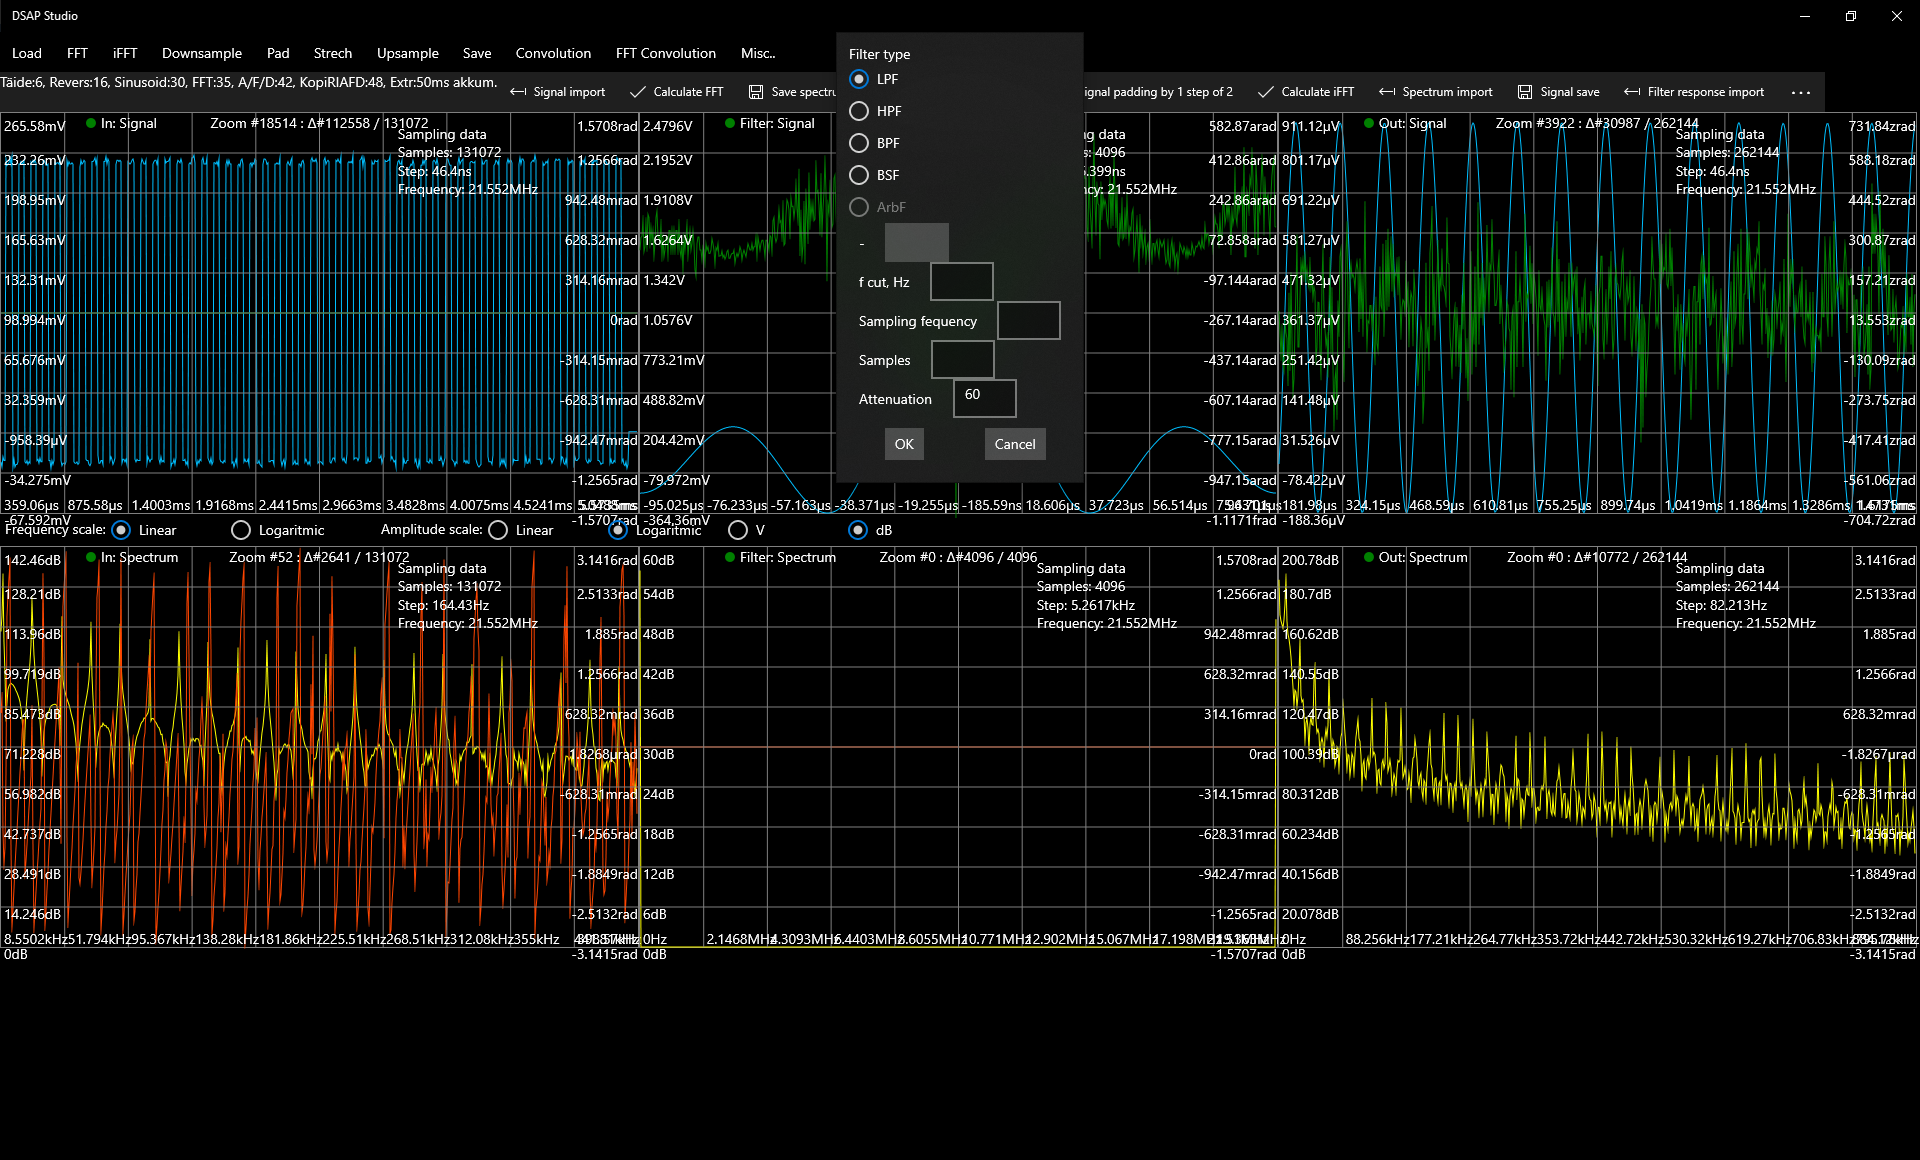
The user can specify the frequency values of the digital filter and analyze the effect of the filter on the input signal accordingly.
The user can generate a signal from several components of different shapes, frequencies and amplitudes and process it with the desired filter. Possible filter types are low pass, high pass , band pass, band stop and arbitrary filter. Spectrum of arbitrary filter can be set by multiple pairs of frequency-attenuation. App sorts points by frequency and shows values with metric prefix (1000 is shown as 1k). 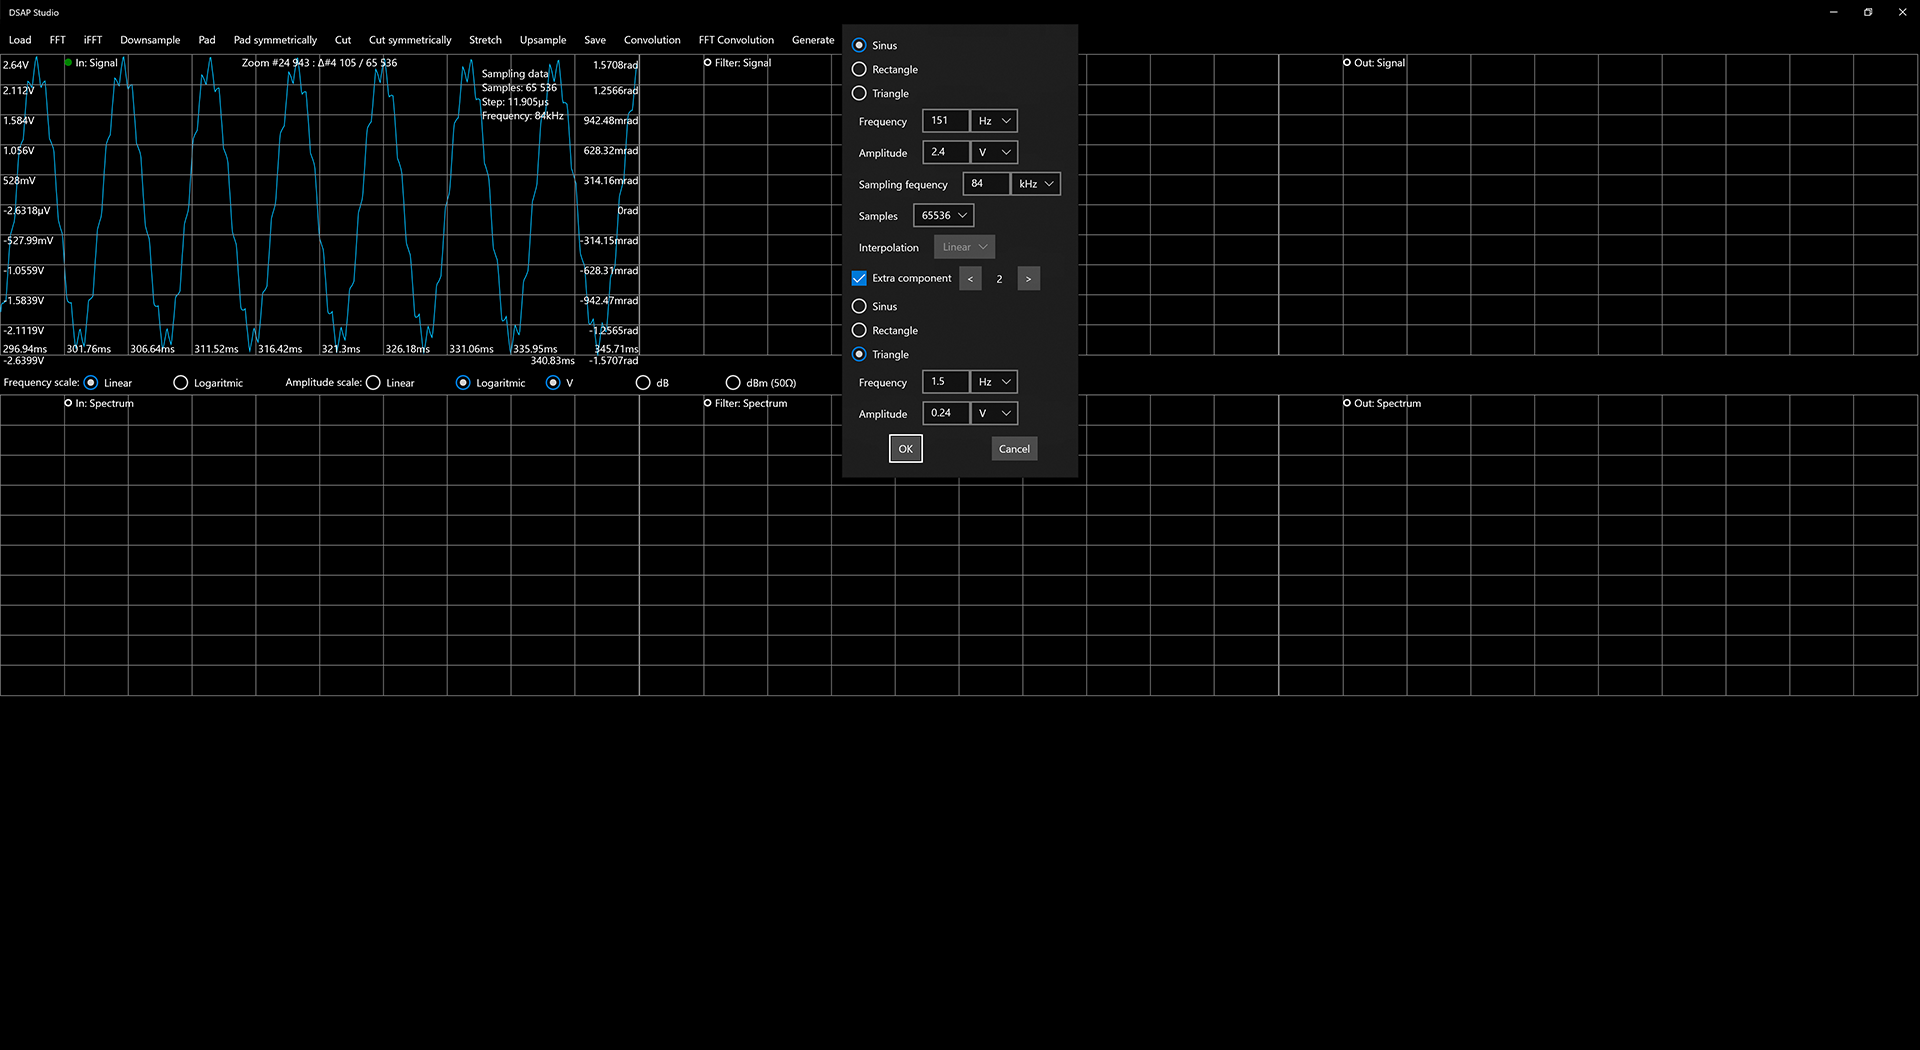
DSAP Studio can use all your computer processing power as it is possible to set to use parallel computing (multi-threading). By parallel computing of FFT or inversed FFT or convolution or FFT convolution you can save a lot of time.
From version 3.5 it is possible to use level in signal and spectrum analyse. You can set a specific level for signal or spectrum and analyse filtered transient samples. This is very useful when signal or spectrum has more samples than display can represent and some interesting samples are decimated or averaged to overall level. In that way you can easily find interesting transient points on horizontal (time or frequency) scale and zoom in (using zoom at cursor feature). Zoom can be set deeper than 1:1 as well, for example 1:0.1 (result will be 10:1 but app shows 1:0.1). When analysing longer signal or spectrum time saving factor will be huge.
App offers level value to middle at first, you can edit that. App opens a table with transient samples as well. This table can be hided/showd at will. To remove level (line) and table enter empty value for level (delete content of value filed on level form).
Tips
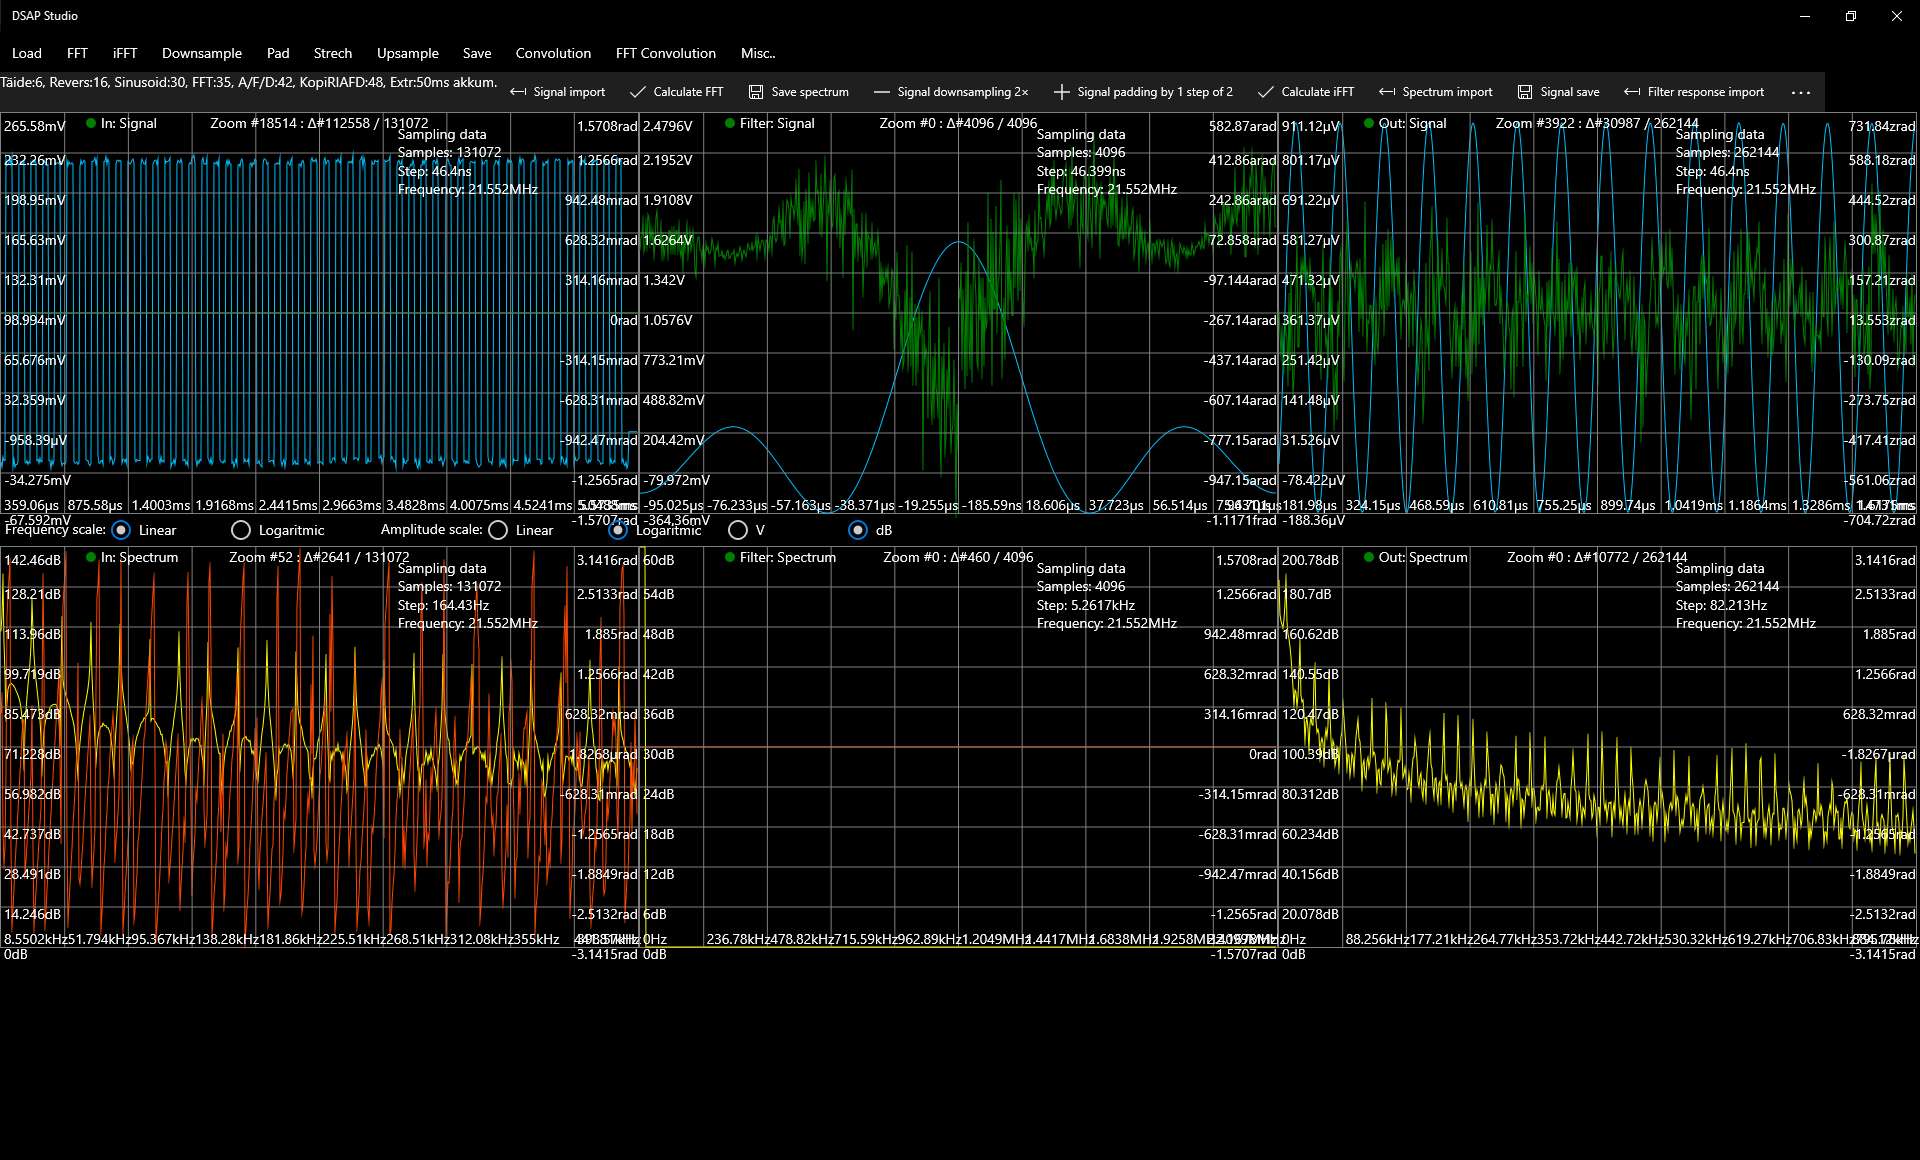
Main view is divided to 3 parts: input, filter and output view. User can switch views on and off to get wider view of particular part. The view switched off holds its data and when switched on again shows it.
User can change color of graphs separately (right-click on mouse). It is also possible to hide/show specific graph.
When move mouse pointer on view the data of signal or spectrum on that point is shown.
Zooming in/out is possible with a) mouse wheel, zoom step is proportional to part of graph visible and horizontal position of pointer. With right-click zoom 1:1/full is possible; b) context menu choice Zoom (mouse right-click) which opens Zoom options: 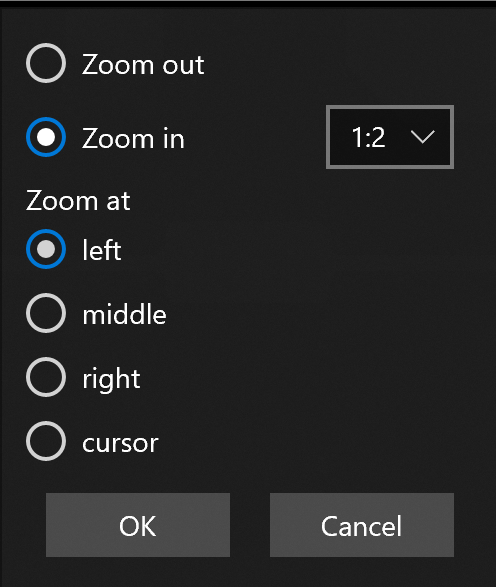
Signal scales (vertical, time) are linear always. Spectrum scales are possible to set linear or logaritmic. When set to logaritmic, the amplitude scale gets option to absolute (Voltage V) and relative (decibels dB or dBm relative to 50 Ω) scales.
Numerics are shown in specified significant numbers (possible to set in settings, default is 5, in trial version between 1 and default, in full version between 1 and 10) and when value is in range 10-24 and 1024 the according metric prefix is used (from y – yocto to Y – yotta).
Vertical scale shows two values: amplitude and phase, amplitude in V, dB or dBm and phase in rad.
DSAP Studio handles easily files with sizes in Gigabytes, for example R&S RTA series oscilloscope can produce export file with 200 Msamples. Size of export file with 100Msamples is about 3GB. Size of corresponding file from DSAP Studio app with full FFT data is about 12GB. Of course limits exist but far enough. As DSAP Studio digital signal processing and digital filter construction software is capable for parallel computing those long signals and spectrums will be easy to process.
App checks imported spectrum and if finds it to be as real-part only then converts it to complex spectrum.
Trial version of DSAP Studio software allows to use all features but saves to file only 4 first values of signal, spectrum, filter or digital filter coefficients data.
Summary of features:
Load input signal
Load input spectrum
Load filter response signal
Load filter response spectrum
Load output signal
Load output spectrum
FFT of input signal
FFT of filter response signal
FFT of output signal
Inverse FFT of input spectrum
Inverse FFT of filter response spectrum
Inverse FFT of output spectrum
Downsample input signal
Pad input signal
Pad filter response signal
Pad symmetrically input signal
Pad symmetrically filter response signal
Cut input signal
Cut filter response signal
Cut symmetrically input signal
Cut symmetrically filter response signal
Stretch input signal
Stretch filter response signal
Upsample (not implemented)
Save input signal
Save input spectrum
Save filter response signal
Save filter coefficients only
Save filter response spectrum
Save output signal
Save output spectrum
In Full version there is option to save double precision data or float (single) precision data
Convolution of input and filter response signals
FFT convolution of input and filter response signals
Generate signal
Generate filter (low-pass, high-pass, band-pass, band-stop, arbitrary)
Settings 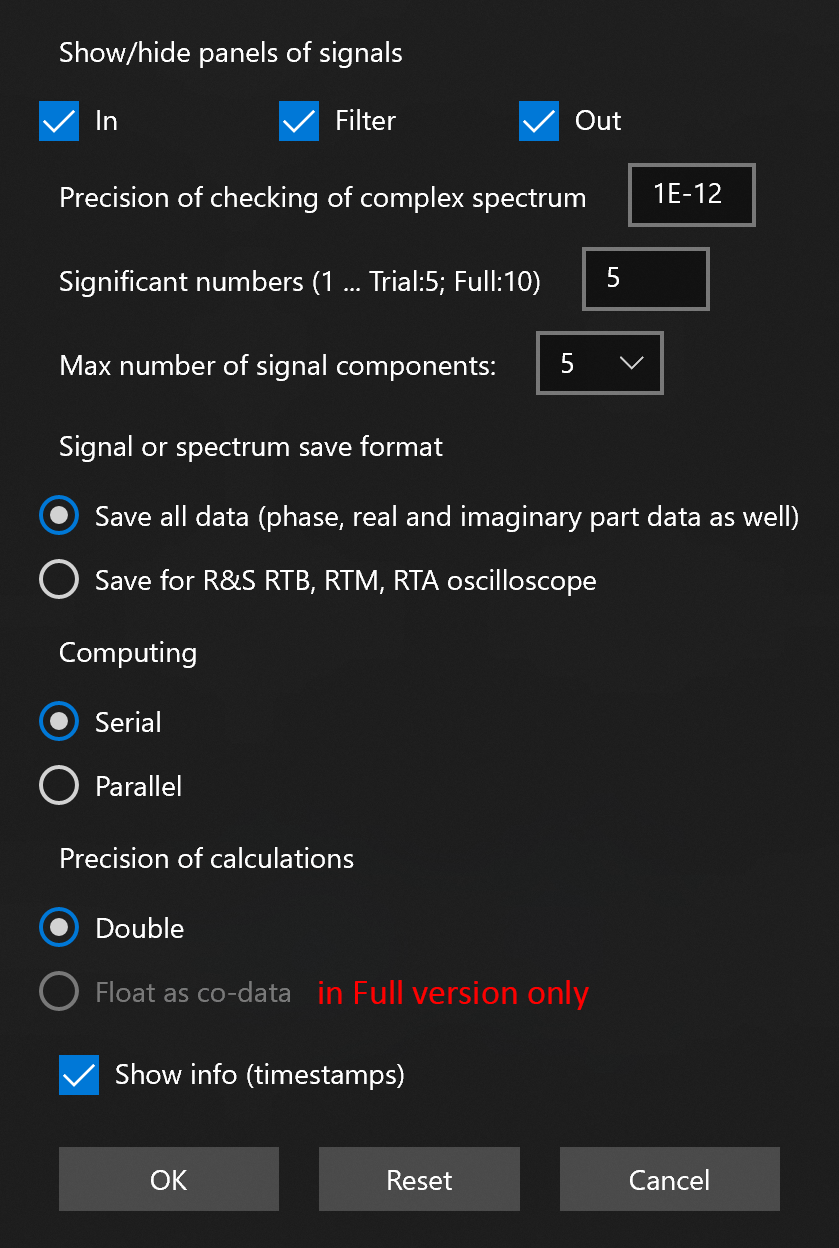
Tips
Check for updates
List of updates (7 Nov 2022 version 3.7):
Window functions. In trial version only Hamming, in full version rectangular, triangular, Hamming, Blackman, Hann, Flat-Top, Welch window functions.
Histograms of signal and spectrum graphs.
A signal or spectrum amplitude level can be set and analyse transient samples.
Can read other signal and spectrum data when set first row position and column data positions, units and multipliers,
Reading out both voltage unit (V) and current unit (A),
Graphs can be zoomed by mouse wheel (was available earlier) or via context menu (zoom options),
Graph zoom status added to zoom info,
User can change number of significant numbers between 1..5 in trial, 1..10 in full version,
Calculations and save data in single (float) precision also (in Full version only),
User can change draw order of graphs,
Free trial possible,
Check for updates,
Parallel computing for FFT, inverse FFT, convolution and FFT convolution,
User can select parallel or serial computing,
Zoom from left or middle added to graphs flyout menu (removed, zooming has been moved to zooming options),
Zoom 1:2 added to graphs flyout menu (removed, zooming has been changed),
Reset button added to signal ja filter generator forms,
Saving user settings,
Reset to default settings,
DSAP Studio website address added to About form,
Added Tips form,
Option in Settings to save all the data or for oscilloscope,
Option to save as .csv file,
Save filter data as filter coefficients only,
Multiple instances of DSAP Studio app can run,
Symmetrical padding of input signal,
Symmetrical padding of filter response signal,
Cutting of input signal,
Cutting of filter response signal,
Symmetrical cutting of input signal,
Symmetrical cutting of filter response signal,
Generate filter response spectrum moved to Generate menu,
Generating of input signal (multicomponent),
Windows of Input, Filter response and Output can be switched on/off,
Settings: number of significant numbers can be adjusted,
Settings: max number of signal components can be adjusted,
dBm scale in vertical scale,
Removed limitations on file size,
Large integers presentation,
Status info to signal and spectrum import,
Status info to signal and spectrum saving,
Load output signal,
Load output spectrum,
FFT of output signal,
inverse FFT of output signal,
Pad filter response signal,
Stretch input signal,
Save filter response signal,
Save filter response spectrum,
Save output signal,
Save output spectrum.
Your feedback is welcome!
Enno Lepvalts
enno@aovalgus.ee